地理空間ラスタデータは、地理情報システム(GIS)や写真測量で多用される成果物である。ラスタデータは典型的には画像や数値標高モデル(DEM)を表現できる。GIS画像を読み込むための標準ライブラリは、Geographic Data Abstraction Library (GDAL) である。この例では、OpenCVのネイティブ関数を用いてGISラスタ形式を読み込む手法を示す。さらに、OpenCVがこのデータを新規かつ興味深い目的にどのように活用できるかの例も示す。
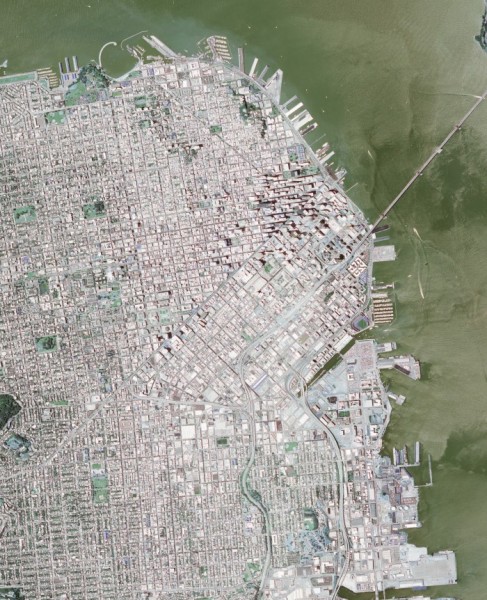
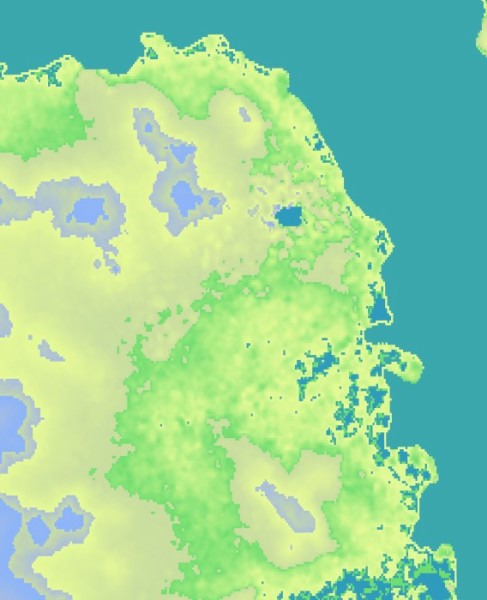
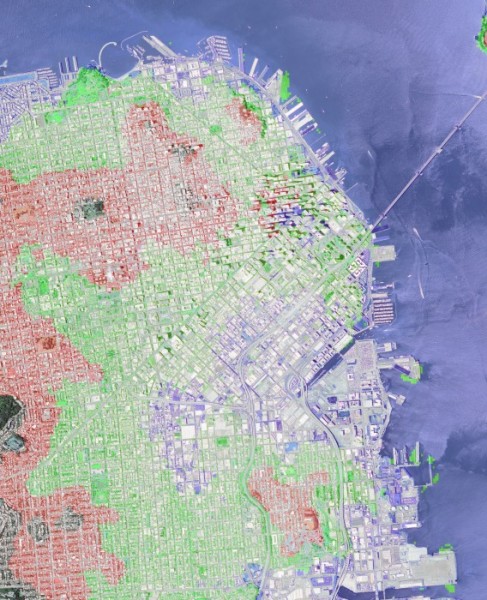
これらの目標を実現するため、以下のコードでは数値標高モデルとサンフランシスコのGeoTiff画像を入力として受け取る。画像とDEMデータを処理し、画像の地形ヒートマップを生成するとともに、湾の水位が10メートル、50メートル、100メートル上昇した場合に影響を受ける都市の領域をラベル付けする。
#include <cmath>
#include <iostream>
#include <stdexcept>
#include <vector>
std::vector<std::pair<cv::Vec3b,double> > color_range;
((1-t)*p1.
y) + (t*p2.
y));
}
template <typename DATATYPE, int N>
double const& t ){
for( int i=0; i<N; i++ ){
output[i] = (
uchar)(((1-t)*minColor[i]) + (t * maxColor[i]));
}
return output;
}
cv::Vec3b get_dem_color(
const double& elevation ){
if( elevation < color_range[0].second ){
return color_range[0].first;
}
if( elevation > color_range.back().second ){
return color_range.back().first;
}
int idx=0;
double t = 0;
for( int x=0; x<(int)(color_range.size()-1); x++ ){
if( elevation < color_range[x+1].second ){
idx=x;
t = (color_range[x+1].second - elevation)/
(color_range[x+1].second - color_range[x].second);
break;
}
}
return lerp( color_range[idx].first, color_range[idx+1].first, t);
}
double demRatioX = ((dem_tr.x - coordinate.
x)/(dem_tr.x - dem_bl.x));
double demRatioY = 1-((dem_tr.y - coordinate.
y)/(dem_tr.y - dem_bl.y));
output.
x = demRatioX * dem_size.
width;
output.
y = demRatioY * dem_size.
height;
return output;
}
double rx = (double)x /
size.width;
double ry = (double)y /
size.height;
return lerp( leftSide, rightSide, rx );
}
if( pix[0] + b < 255 && pix[0] + b >= 0 ){ pix[0] += b; }
if( pix[1] + g < 255 && pix[1] + g >= 0 ){ pix[1] += g; }
if( pix[2] + r < 255 && pix[2] + r >= 0 ){ pix[2] += r; }
}
int main(
int argc,
char* argv[] ){
if( argc < 3 ){
cout << "usage: " << argv[0] << " <image_name> <dem_model_name>" << endl;
return -1;
}
if( dem.
type() !=
CV_16SC1 ){
throw std::runtime_error(
"DEM image type must be CV_16SC1"); }
color_range.push_back( std::pair<cv::Vec3b,double>(
cv::Vec3b( 188, 154, 46), -1));
color_range.push_back( std::pair<cv::Vec3b,double>(
cv::Vec3b( 110, 220, 110), 0.25));
color_range.push_back( std::pair<cv::Vec3b,double>(
cv::Vec3b( 150, 250, 230), 20));
color_range.push_back( std::pair<cv::Vec3b,double>(
cv::Vec3b( 160, 220, 200), 75));
color_range.push_back( std::pair<cv::Vec3b,double>(
cv::Vec3b( 220, 190, 170), 100));
color_range.push_back( std::pair<cv::Vec3b,double>(
cv::Vec3b( 250, 180, 140), 200));
double minElevation = -10;
for(
int y=0; y<image.
rows; y++ ){
for(
int x=0; x<image.
cols; x++ ){
double dz;
if( dem_coordinate.
x >= 0 && dem_coordinate.
y >= 0 &&
dem_coordinate.
x < dem.
cols && dem_coordinate.
y < dem.
rows ){
dz = dem.
at<
short>(dem_coordinate);
}else{
dz = minElevation;
}
if( dz < 10 ){
add_color( output_dem_flood.at<
cv::Vec3b>(y,x), 90, 0, 0 );
}
else if( dz < 50 ){
add_color( output_dem_flood.at<
cv::Vec3b>(y,x), 0, 90, 0 );
}
else if( dz < 100 ){
add_color( output_dem_flood.at<
cv::Vec3b>(y,x), 0, 0, 90 );
}
}}
return 0;
}
Comma-separated Matrix Initializer.
Definition mat.hpp:964
MatSize size
Definition mat.hpp:2511
_Tp & at(int i0=0)
Returns a reference to the specified array element.
int cols
Definition mat.hpp:2488
int rows
the number of rows and columns or (-1, -1) when the matrix has more than 2 dimensions
Definition mat.hpp:2488
int type() const
Returns the type of a matrix element.
_Tp y
y coordinate of the point
Definition types.hpp:202
_Tp x
x coordinate of the point
Definition types.hpp:201
Template class for specifying the size of an image or rectangle.
Definition types.hpp:338
_Tp height
the height
Definition types.hpp:366
_Tp width
the width
Definition types.hpp:365
Template class for short numerical vectors, a partial case of Matx.
Definition matx.hpp:379
Point_< double > Point2d
Definition types.hpp:208
uint8_t uchar
Definition interface.h:35
#define CV_16SC1
Definition interface.h:95
#define CV_8UC3
Definition interface.h:79
@ IMREAD_ANYDEPTH
If set, return 16-bit/32-bit image when the input has the corresponding depth, otherwise convert it t...
Definition imgcodecs.hpp:74
@ IMREAD_LOAD_GDAL
If set, use the gdal driver for loading the image.
Definition imgcodecs.hpp:76
@ IMREAD_COLOR
Same as IMREAD_COLOR_BGR.
Definition imgcodecs.hpp:73
bool imwrite(const String &filename, InputArray img, const std::vector< int > ¶ms=std::vector< int >())
Saves an image to a specified file.
Mat imread(const String &filename, int flags=IMREAD_COLOR_BGR)
Loads an image from a file.
int main(int argc, char *argv[])
Definition highgui_qt.cpp:3
GOpaque< Size > size(const GMat &src)
Gets dimensions from Mat.
数値標高モデルを読み込む際は、各ピクセルの実際の数値が本質的に重要であり、スケーリングや切り捨てを行ってはならない。例えば画像データでは、値1のdoubleとして表されるピクセルは、値255のunsigned charとして表されるピクセルと同じ見た目になる。地形データでは、ピクセル値は標高(メートル単位)を表す。OpenCVがネイティブ値を保持することを保証するには、imread でGDALフラグをANYDEPTHフラグとともに使用する。
読み込もうとしているDEMモデルの型が事前に分かっている場合は、assertやその他の仕組みを使ってMat::type() またはMat::depth() をテストするのが安全策となる。NASAやDODの仕様書には、各種標高モデルの入力型が記載されている。主要な型であるSRTMとDTEDは、いずれもsigned shortである。
地理座標系は球面座標系であり、これをデカルト数学とともに用いるのは技術的には正しくない。このデモでは可読性を高めるためにこれらを使用しており、要点を示すには十分な精度である。より適切な座標系はUniversal Transverse Mercator(UTM)である。
\f$> gdalinfo N37W123.hgt
Driver: SRTMHGT/SRTMHGT File Format
Files: N37W123.hgt
Size is 3601, 3601
Coordinate System is:
GEOGCS["WGS 84",
DATUM["WGS_1984",
... more output ...
Corner Coordinates:
Upper Left (-123.0001389, 38.0001389) (123d 0' 0.50"W, 38d 0' 0.50"N)
Lower Left (-123.0001389, 36.9998611) (123d 0' 0.50"W, 36d59'59.50"N)
Upper Right (-121.9998611, 38.0001389) (121d59'59.50"W, 38d 0' 0.50"N)
Lower Right (-121.9998611, 36.9998611) (121d59'59.50"W, 36d59'59.50"N)
Center (-122.5000000, 37.5000000) (122d30' 0.00"W, 37d30' 0.00"N)
... more output ...